GetStudySolution
Getstudysolution is an online educational platform that allows students to access quality educational services and study materials at no cost.
NCERT Solutions for class 4 Maths chapter 14 – Smart Charts
Back Exercise
Page No 162:
Question 1:
• Note the time you spend in front of a TV or radio every day. Do this for one week. The time spend in a week is ________ hours. So in a month you spend about 30 × ____ = ____ hours.
• Find out from your friends the time they spend in a week.
| How many hours they watch TV or listen to the radio (in a week) | Number of Children |
| More than 6 hours | |
| Six hours | |
| Five hours | |
| Four hours | |
| Three hours | |
| Two hours | |
| One hour | |
| Zero hour (do not watch) |

Answer:
• Time spent in front of TV or radio every day = 1 hour ∴ Time spent in a week = 7
×1 hour = 7 hours Total time spent in a month = 30
×1 hour = 30 hours
•
| How many hours they watch TV or listen to the radio (in a week) | Number of Children |
| More than 6 hours | 5 |
| Six hours | 7 |
| Five hours | 4 |
| Four hours | 10 |
| Three hours | 12 |
| Two hours | 15 |
| One hour | 8 |
| Zero hour (do not watch) | 1 |
Disclaimer: The answer may vary from student to student based on his/her experience. The answer provided here is for reference only.
Page No 163:
Question 1:
From your table
Watching TV/listening to the radio…
• ________ children spend more than 6 hours in a week. • ________ children spend no time at all. • Most children spend ________ hours in a week. • ________ children spend more than 3 hours.
Answer:
Disclaimer: The answer may vary from student to student based on his/her experience. It is highly recommended that students prepare the answer on their own.
Question 2:
Ask people in your family to name one programme they like and one programme they dislike. Make a table.
| Family member | Programme they like | Programme they dislike |
| Mother | ||
| Father | ||
The kind of programme most family members like _______________ The kind of programme most family members dislike __________
Answer:
Disclaimer: The answer may vary from student to student based on his/her experience. It is highly recommended that students prepare the answer on their own.
Page No 164:
Question 1:
Find out from 20 friends the programmes they like and dislike, and write in a table.
| Kind of programme | Number of children liking it | Number of children disliking is |
| Cartoons Comedy shows Sports |
• Which kind of programme is liked by most children? • Which kind of programme is disliked by the least number of children? • How many children like sports programmes? • Is there any kind of programme not liked by any one? Yes/No If yes, which one? ___________.
Answer:
Disclaimer: The answer may vary from student to student based on his/her experience. It is highly recommended that students prepare the answer on their own.
Question 2:
Who is my friend? I’ve a friend with me always, In the nights and through the days. When I run he runs with me, Sometimes I lead, sometimes he. When it’s dark he can’t be seen, Do you know which friend I mean?
• Read the poem carefully and answer these questions: (a) Which word comes most often in the poem? (b) Which letter has been used most? (c) Which letter comes the least?
• Take a paragraph you like from your language textbook. Read carefully and find out: (a) Which word comes most often? _________ How many times? ________ (b) Which word comes least often? _________ (c) The letter used most often is _________ (d) The letter used least often is _________
Answer:
- (a) The word ‘I’ comes most often in the poem.
(b) The letter ‘E’ has been used most in the poem.
(c) The letters ‘B’ and ‘V’ come the least in the poem.
- Disclaimer: The answer may vary from student to student based on his/her experience. It is highly recommended that students prepare the answer on their own.
Page No 166:
Question 1:
Find out from your classmates and fill the table:
| Main food | Number of persons |
| Rice | |
| Wheat | |
Look at the table and tell: • Most children eat food made from __________. • Compared to children who eat rice, those who eat wheat are more/less/equal. • Compared to those who eat wheat, children eating ragi are more/less.
Answer:
Disclaimer: The answer may vary from student to student based on his/her observation. It is highly recommended that students prepare the answer on their own.
Page No 167:
Question 1:

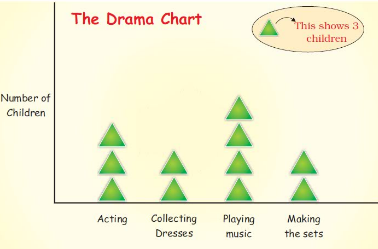
(a) How many children are acting in the drama? (b) Which are more — children making the sets or those acting? (c) What is being done by most of the children? (d) How many children are collecting dresses?
Answer:
(a) 3 children are acting in the drama.
(b) Children who are acting are more in number than children who are making the sets.
(c) Most of the children are playing music.
(d) Two children are collecting dresses.
Page No 168:
Question 1:
• Use a scale and find out from your chart: The length of the longest strip is ________ cm. So ________ has the biggest head. The smallest strip is _________ cm long. It belongs to _________.
Answer:
Disclaimer: The answer may vary from student to student based on his/her observation. It is highly recommended that students prepare the answer on their own.
Question 2:
The Chapati Chart shows the number of children in different clubs.
.png)
From the picture we can see that: (a) Half the children in the class take part in the Games Club. (b) One fourth of the children are members of the Garden Club. (c) The Drawing Club has one fourth of the children of the class.
If there are 200 students in the school, look at the above Chapati Chart and tell the number of members in each club: • The Games Club has _________ members. • The Garden Club has __________ members. • There are __________ members in the Drawing Club.
Answer:
Total students = 200
- Members in the Games Club = 200 ÷ 2 = 100
- Members in the Garden Club = 200 ÷ 4 = 50
- Members in the Drawing Club = 200 ÷ 4 = 50
Page No 169:
Question 1:
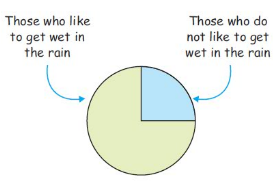
Getting Wet in the Rain Who likes to get wet in the rain? A child made this Chapati Chart after asking his friends. 
See the Chapati Chart and tell: (1) How many children like to get wet in the rain? (a) half (b) one-fourth (c) three-fourth
(2) How many children do not like to get wet in the rain? (a) half (b) one-fourth (c) three-fourth
If the number of children in the class is 28, then tell the number of children • who like to get wet in the rain ____________ • who do not like to get wet in the rain ___________
Answer:
(1) (c) three-fourth
(2) (b) one-fourth
Number of children in the class = 28 ∴ Number of children who do not like to get wet in the rain = 28 ÷ 4 = 7 Number of children who like to get wet in the rain = 7 × 3 = 21
If the number of children in the class is 28, then tell the number of children
- who like to get wet in the rain 21
- who do not like to get wet in the rain 7
Page No 170:
Question 1:
Tea, Coffee or Milk Some children were asked which of these they liked most — Tea, Coffee or Milk.
| The drink they like | Number of children |
| Milk | 20 |
| Coffee | 10 |
| Tea | 10 |
Total Number of children __________
Find out from the table: • Children who like milk are
12/14of the total children. • Children who like coffee are
12/14of the total children. Show the liking for Tea, Coffee or Milk in a Chapati Chart.
Answer:
Total number of children = 20 + 10 + 10 = 40
• Children who like milk are
12of the total children. • Children who like coffee are
14of the total children
Chapati Chart for tea, coffee and milk is given below:
(1).png)